
How No10’s experts manipulated data and drew biased conclusions to ‘terrify’ England into locking down
Ross Clark – Daily Mail Nov 2, 2020
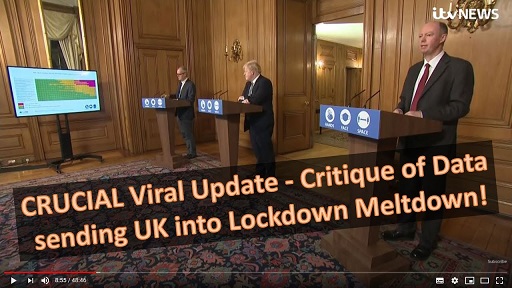
It was the Halloween horror no one had been expecting: a series of mind-boggling graphs and charts presented at Saturday’s Downing Street press conference that purported to show the Covid-19 pandemic was out of control and a second national lockdown was needed.
But do the graphs and charts really support this? ROSS CLARK find outs …
The Heat Map
This chart was designed to show that some hospitals – shown in red – already had more Covid-19 patients than at the peak of the first wave in the spring.
Hospitals shown in amber have more than half as many virus patients as they had then, while green indicates hospitals with fewer than half the number of patients they had at the peak of the first wave.
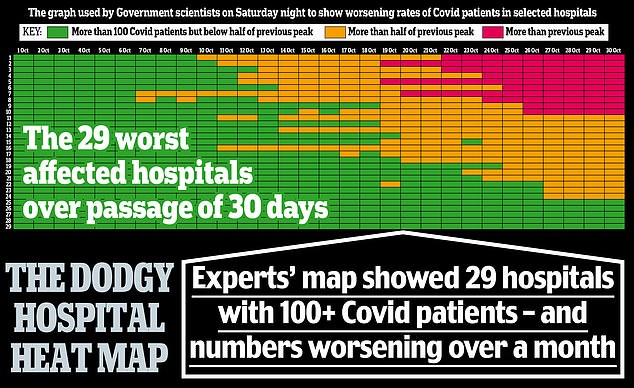
This chart was designed to show that some hospitals – shown in red – already had more Covid-19 patients than at the peak of the first wave in the spring. Click to enlarge
Certainly the chart gave the impression that hospitals were already close to overflowing.
But the truth isn’t nearly as terrifying.
For while 29 hospitals are shown on the slide, the full dataset, published by NHS England, actually includes 482 NHS and private hospitals in England – at least 232 of which (and probably more as some entries were left blank) had not a single Covid-19 patient on October 27.
This is hardly surprising since official figures showed there were 9,213 patients in hospital with the disease on October 31, compared with 17,172 at the spring peak.
Even back then hospitals were far from full and the Nightingale units were virtually empty.
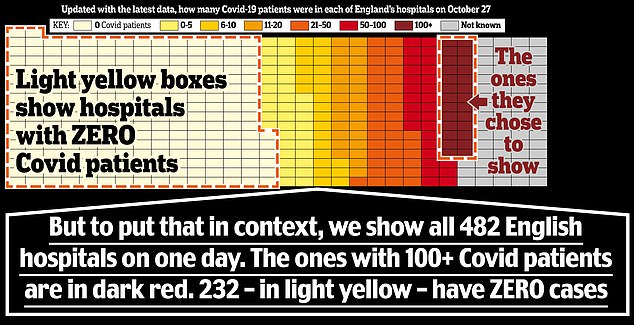
For while 29 hospitals are shown on the slide, the full dataset, published by NHS England, actually includes 482 NHS and private hospitals in England at least 232 of which had not a single Covid-19 patient on October 27. Click to enlarge
WHERE CASES ARE ACTUALLY FALLING
Chris Whitty unveiled two charts showing where in England Covid-19 infections were increasing, with brown and yellow zones highlighting where cases were up and blue showing they were down.
‘Virtually across the entire country now there is a significant rate of increase,’ announced the chief medical officer.
The map, however, begs to differ. In fact, it shows there are 34 districts in England where cases are static or falling.
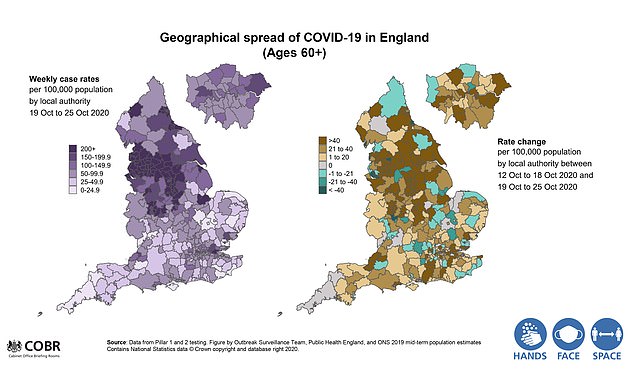
Two charts showing where in England Covid-19 infections were increasing, with brown and yellow zones highlighting where cases were up and blue showing they were down. Click to enlarge
Most remarkably – although it is difficult to spot, and only becomes obvious when you magnify the chart – it reveals that cases have fallen sharply across Merseyside over the past week, and that in parts of Liverpool they have fallen by more than 60 per cent.
This is significant because Liverpool was the first part of the country to be placed into Tier Three restrictions.
But if such measures appear to be working, why the need for the second national lockdown?
IS GROWTH REALLY EXPONENTIAL?
One slide – based on data from tests on a randomised sample of the population – showed ‘the prevalence of the disease has been going up extremely rapidly over the past few weeks’.
However, the chart actually suggested that the rate was no longer increasing exponentially, contrary to what Sir Patrick Vallance, the chief scientific adviser, predicted in his briefing of September 14.
While the chart shows that in mid-September cases of Covid were doubling almost every week, the most recent figures show that it has taken two and a half weeks for another two-fold rise.
While the chart shows that in mid-September cases of Covid were doubling almost every week, the most recent figures show that it has taken two and a half weeks for another two-fold rise. Click to enlarge
REGIONAL RATES
Another slide consists of regional charts based on Office for National Statistics data about the prevalence of Covid-19 in the general population.
Professor Whitty heralded this as proof that ‘there is an increase in every part of the country apart possibly from the North East, where they have been taking additional measures – and there is some evidence of some flattening but not so far of falling’.
Yet the graph on the slide didn’t tally with that. It instead showed a clear fall in infection numbers in the North East.
Moreover, the curve is clearly flattening in London, the West Midlands and the South East.
VIRUS SLOWING AMONG MOST VULNERABLE
A further chart shows confirmed Covid-19 cases, week by week, for each region of England, split by age group with under-16s at the bottom and the over-60s at the top.
Professor Whitty used it to claim that the infection ‘steadily moves up the ages, so it doesn’t remain constrained by any one age group’.
The ripple change in the colours certainly seemed to support this.
But on closer inspection – only visible if you magnify the image – it becomes clear the chart contains figures in each coloured box for infections per 100,000 people.
What they show is that, crucially, rates of infection are growing much more slowly among the vulnerable over-60s than among young people in September, when there was a surge among students.
It has taken 24 days for over-60 cases to double in the North East and the North West, and 18 days in London.
In the North West new cases have been flat for four days – suggesting the pandemic is not ripping through the over-60s as previously assumed.
R RATE IN REVERSE
The R number is the average number infected by a single carrier. If the figure is below one, the epidemic withers; above one and it grows.
This slide clearly showed that the R number had fallen back in the past three weeks to between 1.1 and 1.3 – suggesting that while the epidemic was still growing, it was doing so at a slower rate.
Yet despite this encouraging sign, Sir Patrick used the slide as an opportunity to explain that the Government has asked academics to produce scenarios of what might happen ‘on assumptions that R stays above one and goes between 1.3 to 1.5 and possibly up over the course of the winter’.
But why would they use such an inflated value, especially given the recent restrictions in Tier Three and Three areas? Naturally, he didn’t say.
Who CARES what silly graphs the Gates-funded professional LIARS come up with?
While all this flunacy has been rammed down people’s throats 24 hours a day, honest people with REAL medical knowledge have been educating those of us who care to look for the facts with revelations such as the FACT that the entire “germ theory” was fraudulent from it’s inception, and even more so in the case of mythical “viruses”, which were invented purely as a way of deflecting public attention from the REAL causes of illness.
One such honest person summed it up in a single sentence, something along the lines of …
The only causes of illness are deficiency and toxicity.
Chemtrails are almost certainly toxic.
Food additives are usually toxic.
Physical and emotional stress is EXTREMELY toxic (think government fear mongering).
Electricity and magnetism are toxic, and have long been known to cause colds and ‘flu, or to use it’s full name (from the Italian) “influenza delle stelle”, as documented in Arthur Firstenberg’s book “The Invisible Rainbow”.
As for deficiency, processed “foods” and even farm-fresh produce from depleted soils are seriously deficient in many essential nutrients.
There is NO “deadly virus” because there are NO viruses capable of causing disease in Humans. The whole thing is an internationally co-ordinated SCAM, an attempt to impose (((communism))) on the whole world.
THERE IS NO KILLER PLAGUE. WE ARE BEING LIED TO ON A SCALE NEVER BEFORE SEEN IN THE HISTORY OF THE WORLD.
No amount of factual evidence will cause this Government clique to change direction. Facts no longer matter. All that matters is that the public remains terrified and locked down as per the guidelines of the Behavioural Insights Team. All this is proving is that the Government has drastically underestimated the reaction of both the public, but more importantly the response from other pandemic specialists from varying fields of expertise who are contradicting the official narrative with real FACTS. How much longer can this charade continue? Soon it will only be those in Government circles and their health advisors who believe their own propaganda: the rest of the public are getting thoroughly hacked off. It cannot continue much longer.
forget these fake graphs all of wghich are a fraud. Nota bene – covid 19 does not exit. it has not been isolated under the renonwned Kochs Postulates. the ferguson of imperial computer model has been shown that it is not fit for purpose not once, note twice but at least three time in the past (mad cows, bird flu). the inventor and noble prize winner of the pcr test kit has said it is not to be used for this type of testing.so why the haste in lockdowns and restrictions on peoples liberty unless there is a hidden agenda – the great reset, total control and money. notice as well how the government’s mantra has changed from deaths to cases toi inflate the numbers as the former was not providing the numbers. all deaths if tested positive are covid related even iif death occurred through hear attack. parliament is not sovereign – the people are. what to do. a calss action to charge the government, ministers, mps and police officials for crimes of fraud, treason etc. just following orders is no defence and neither is ignorantia legis non excusat
As the media is more or less an arm of the state I think if it’s questioning the government’s position it’s likely because it’s been asked to. Maybe the government gathers from what it’s being told by doctors, the police, military officers, letters to its MPs etc, that there’ll be a pushback from many quarters which will soon be undeniable? And as a get-out clause if it must retreat, it can then blame the media for coming out against it? The promise of funds through advertisements, promises of interviews and promises of knighthoods could do it.
What offensive comment did I make this time? Merkel getting her treatment? Why the censorship? This site can only be accessed by a tiny number of people.
The Daily Mail are the Biggest liars in all this. One second they are peddling the Governments rhetoric on Covid, then next thing they post a story to get its readers onside. Then just repeats this over and over again. Rumour had it that they were being paid by the Government to post this shite. If you go look at other online Tabloid shite, nobody is posting the same amount of covid crap. It was all Trump and Brexit. Plus the Daily Mail is all click bait with po.r.n. to raise Revenue. They are a Business after all.